class: left, bottom background-image: url("https://live.staticflickr.com/65535/50367566131_d113e26988_d.jpg") background-position: right background-size: auto # Markdown Slides & Github ### Serving Slides to the World <p> </p> <p> </p> <img src="https://live.staticflickr.com/65535/50913544171_9a2f1a6252_z_d.jpg" width="400px"> --- class: sectionTitle # But WHY? --- class: left, bottom background-image: url("https://live.staticflickr.com/65535/51113440438_a05ea68123_o_d.png") background-position: right background-size: cover --- # **95%** of all presentations suck! .center[ <img src="slides_files/figure-html/unnamed-chunk-1-1.png" width="600" /> ] --- # Examples .pull-left[  I don't care enough about my audience to even photocopy something square ] -- .pull-right[  I know that if I put a lot of crap on a slide my audience will actually spend time reading it instead of listening to me talk about the subject I am *supposed* to be an expert in. ] --- class: center, middle # OK, perhaps **95%** was a bit too generous! --- class: center, middle # .red[Why?] --- # What is being attempted .pull-left[ ## Attempting - Understanding - Competence - Storytelling - Projection - Humor ] -- .pull-right[ ## Demonstrating - Too Long - Poor Graphics - Boring - Crowded Slides - Incoherence ] --- # The Audience Wants (Deserves) .center[ ### Short ### Clean ### Legible ### Engaging ### Memorable ] --- class: left, bottom background-image: url("https://live.staticflickr.com/65535/51113446273_c508a8158b_o_d.png") background-position: center background-size: auto --- class: left, bottom background-image: url("https://live.staticflickr.com/65535/51113536001_e6a4219e50_o_d.png") background-position: center background-size: auto --- class: left, bottom background-image: url("https://live.staticflickr.com/65535/51114324835_9c9048e495_o_d.png") background-position: center background-size: auto --- class: left, bottom background-image: url("https://live.staticflickr.com/65535/51112972097_e7f4bd238c_c_d.jpg") background-position: center background-size: auto --- class: left, bottom background-image: url("https://live.staticflickr.com/65535/51113294404_bb80ca4336_c_d.jpg") background-position: center background-size: auto --- class: left, bottom background-image: url("https://live.staticflickr.com/65535/51113537746_f2a8552aff_o_d.png") background-position: right background-size: cover --- class: sectionTitle # Slides in Markdown --- .left-column[ # Built-In Types RStudio has the following types built-in: - ioslides - Slidy - Beamer - Powerpoint (don't laugh) ] .right-column[  ] --- class: middle # Xaringan Slides ( Xar·in·gan) ## /ʃæ.'riŋ.ɡæn/ .pull-left[  ] -- .pull-right[  ] --- class: center, middle <iframe src="https://remarkjs.com/#1" width="800" height="600"></iframe> --- class: middle, center ## .redinline[Remark.js] does not take `R` code natively, but... -- ## .greeninline[Xaringan] provides the link. --- # Difference from Normal Markdown ## Markdown Workflow  -- ### Xaringan Workflow  --- # Installation of Xaringan Let's install this package directly from its [GitHub repository](https://github.com/yihui/xaringan). ```r remotes::install_github("yihui/xaringan") ``` --- class: sectionTitle # Using Github --- class: left, bottom background-image: url("https://live.staticflickr.com/65535/51115874990_9e4a5a4d32_b_d.jpg") background-position: top background-size: cover --- # Make `Presentations` Repository On Github 💻 <svg aria-hidden="true" role="img" viewBox="0 0 496 512" style="height:1em;width:0.97em;vertical-align:-0.125em;margin-right:0.2em;font-size:inherit;fill:currentColor;overflow:visible;position:relative;"><path d="M165.9 397.4c0 2-2.3 3.6-5.2 3.6-3.3.3-5.6-1.3-5.6-3.6 0-2 2.3-3.6 5.2-3.6 3-.3 5.6 1.3 5.6 3.6zm-31.1-4.5c-.7 2 1.3 4.3 4.3 4.9 2.6 1 5.6 0 6.2-2s-1.3-4.3-4.3-5.2c-2.6-.7-5.5.3-6.2 2.3zm44.2-1.7c-2.9.7-4.9 2.6-4.6 4.9.3 2 2.9 3.3 5.9 2.6 2.9-.7 4.9-2.6 4.6-4.6-.3-1.9-3-3.2-5.9-2.9zM244.8 8C106.1 8 0 113.3 0 252c0 110.9 69.8 205.8 169.5 239.2 12.8 2.3 17.3-5.6 17.3-12.1 0-6.2-.3-40.4-.3-61.4 0 0-70 15-84.7-29.8 0 0-11.4-29.1-27.8-36.6 0 0-22.9-15.7 1.6-15.4 0 0 24.9 2 38.6 25.8 21.9 38.6 58.6 27.5 72.9 20.9 2.3-16 8.8-27.1 16-33.7-55.9-6.2-112.3-14.3-112.3-110.5 0-27.5 7.6-41.3 23.6-58.9-2.6-6.5-11.1-33.3 2.6-67.9 20.9-6.5 69 27 69 27 20-5.6 41.5-8.5 62.8-8.5s42.8 2.9 62.8 8.5c0 0 48.1-33.6 69-27 13.7 34.7 5.2 61.4 2.6 67.9 16 17.7 25.8 31.5 25.8 58.9 0 96.5-58.9 104.2-114.8 110.5 9.2 7.9 17 22.9 17 46.4 0 33.7-.3 75.4-.3 83.6 0 6.5 4.6 14.4 17.3 12.1C428.2 457.8 496 362.9 496 252 496 113.3 383.5 8 244.8 8zM97.2 352.9c-1.3 1-1 3.3.7 5.2 1.6 1.6 3.9 2.3 5.2 1 1.3-1 1-3.3-.7-5.2-1.6-1.6-3.9-2.3-5.2-1zm-10.8-8.1c-.7 1.3.3 2.9 2.3 3.9 1.6 1 3.6.7 4.3-.7.7-1.3-.3-2.9-2.3-3.9-2-.6-3.6-.3-4.3.7zm32.4 35.6c-1.6 1.3-1 4.3 1.3 6.2 2.3 2.3 5.2 2.6 6.5 1 1.3-1.3.7-4.3-1.3-6.2-2.2-2.3-5.2-2.6-6.5-1zm-11.4-14.7c-1.6 1-1.6 3.6 0 5.9 1.6 2.3 4.3 3.3 5.6 2.3 1.6-1.3 1.6-3.9 0-6.2-1.4-2.3-4-3.3-5.6-2z"/></svg> .center[] --- # Make New Project From Github 💻 <svg aria-hidden="true" role="img" viewBox="0 0 496 512" style="height:1em;width:0.97em;vertical-align:-0.125em;margin-right:0.2em;font-size:inherit;fill:currentColor;overflow:visible;position:relative;"><path d="M165.9 397.4c0 2-2.3 3.6-5.2 3.6-3.3.3-5.6-1.3-5.6-3.6 0-2 2.3-3.6 5.2-3.6 3-.3 5.6 1.3 5.6 3.6zm-31.1-4.5c-.7 2 1.3 4.3 4.3 4.9 2.6 1 5.6 0 6.2-2s-1.3-4.3-4.3-5.2c-2.6-.7-5.5.3-6.2 2.3zm44.2-1.7c-2.9.7-4.9 2.6-4.6 4.9.3 2 2.9 3.3 5.9 2.6 2.9-.7 4.9-2.6 4.6-4.6-.3-1.9-3-3.2-5.9-2.9zM244.8 8C106.1 8 0 113.3 0 252c0 110.9 69.8 205.8 169.5 239.2 12.8 2.3 17.3-5.6 17.3-12.1 0-6.2-.3-40.4-.3-61.4 0 0-70 15-84.7-29.8 0 0-11.4-29.1-27.8-36.6 0 0-22.9-15.7 1.6-15.4 0 0 24.9 2 38.6 25.8 21.9 38.6 58.6 27.5 72.9 20.9 2.3-16 8.8-27.1 16-33.7-55.9-6.2-112.3-14.3-112.3-110.5 0-27.5 7.6-41.3 23.6-58.9-2.6-6.5-11.1-33.3 2.6-67.9 20.9-6.5 69 27 69 27 20-5.6 41.5-8.5 62.8-8.5s42.8 2.9 62.8 8.5c0 0 48.1-33.6 69-27 13.7 34.7 5.2 61.4 2.6 67.9 16 17.7 25.8 31.5 25.8 58.9 0 96.5-58.9 104.2-114.8 110.5 9.2 7.9 17 22.9 17 46.4 0 33.7-.3 75.4-.3 83.6 0 6.5 4.6 14.4 17.3 12.1C428.2 457.8 496 362.9 496 252 496 113.3 383.5 8 244.8 8zM97.2 352.9c-1.3 1-1 3.3.7 5.2 1.6 1.6 3.9 2.3 5.2 1 1.3-1 1-3.3-.7-5.2-1.6-1.6-3.9-2.3-5.2-1zm-10.8-8.1c-.7 1.3.3 2.9 2.3 3.9 1.6 1 3.6.7 4.3-.7.7-1.3-.3-2.9-2.3-3.9-2-.6-3.6-.3-4.3.7zm32.4 35.6c-1.6 1.3-1 4.3 1.3 6.2 2.3 2.3 5.2 2.6 6.5 1 1.3-1.3.7-4.3-1.3-6.2-2.2-2.3-5.2-2.6-6.5-1zm-11.4-14.7c-1.6 1-1.6 3.6 0 5.9 1.6 2.3 4.3 3.3 5.6 2.3 1.6-1.3 1.6-3.9 0-6.2-1.4-2.3-4-3.3-5.6-2z"/></svg> .center[  ] --- # New Presentation On Github 💻 <svg aria-hidden="true" role="img" viewBox="0 0 496 512" style="height:1em;width:0.97em;vertical-align:-0.125em;margin-right:0.2em;font-size:inherit;fill:currentColor;overflow:visible;position:relative;"><path d="M165.9 397.4c0 2-2.3 3.6-5.2 3.6-3.3.3-5.6-1.3-5.6-3.6 0-2 2.3-3.6 5.2-3.6 3-.3 5.6 1.3 5.6 3.6zm-31.1-4.5c-.7 2 1.3 4.3 4.3 4.9 2.6 1 5.6 0 6.2-2s-1.3-4.3-4.3-5.2c-2.6-.7-5.5.3-6.2 2.3zm44.2-1.7c-2.9.7-4.9 2.6-4.6 4.9.3 2 2.9 3.3 5.9 2.6 2.9-.7 4.9-2.6 4.6-4.6-.3-1.9-3-3.2-5.9-2.9zM244.8 8C106.1 8 0 113.3 0 252c0 110.9 69.8 205.8 169.5 239.2 12.8 2.3 17.3-5.6 17.3-12.1 0-6.2-.3-40.4-.3-61.4 0 0-70 15-84.7-29.8 0 0-11.4-29.1-27.8-36.6 0 0-22.9-15.7 1.6-15.4 0 0 24.9 2 38.6 25.8 21.9 38.6 58.6 27.5 72.9 20.9 2.3-16 8.8-27.1 16-33.7-55.9-6.2-112.3-14.3-112.3-110.5 0-27.5 7.6-41.3 23.6-58.9-2.6-6.5-11.1-33.3 2.6-67.9 20.9-6.5 69 27 69 27 20-5.6 41.5-8.5 62.8-8.5s42.8 2.9 62.8 8.5c0 0 48.1-33.6 69-27 13.7 34.7 5.2 61.4 2.6 67.9 16 17.7 25.8 31.5 25.8 58.9 0 96.5-58.9 104.2-114.8 110.5 9.2 7.9 17 22.9 17 46.4 0 33.7-.3 75.4-.3 83.6 0 6.5 4.6 14.4 17.3 12.1C428.2 457.8 496 362.9 496 252 496 113.3 383.5 8 244.8 8zM97.2 352.9c-1.3 1-1 3.3.7 5.2 1.6 1.6 3.9 2.3 5.2 1 1.3-1 1-3.3-.7-5.2-1.6-1.6-3.9-2.3-5.2-1zm-10.8-8.1c-.7 1.3.3 2.9 2.3 3.9 1.6 1 3.6.7 4.3-.7.7-1.3-.3-2.9-2.3-3.9-2-.6-3.6-.3-4.3.7zm32.4 35.6c-1.6 1.3-1 4.3 1.3 6.2 2.3 2.3 5.2 2.6 6.5 1 1.3-1.3.7-4.3-1.3-6.2-2.2-2.3-5.2-2.6-6.5-1zm-11.4-14.7c-1.6 1-1.6 3.6 0 5.9 1.6 2.3 4.3 3.3 5.6 2.3 1.6-1.3 1.6-3.9 0-6.2-1.4-2.3-4-3.3-5.6-2z"/></svg> .center[  --- class: middle, center # Go play with Xaringan!  --- class: sectionTitle # Deploying on Github --- class: left, bottom background-image: url("https://live.staticflickr.com/65535/51115114901_e4b09956f9_c_d.jpg") background-position: center background-size: cover --- class: left, bottom background-image: url("https://live.staticflickr.com/65535/51115122666_828982f713_b_d.jpg") background-position: top background-size: cover --- # Deploying Many Presenatations 1. Make an index.Rmd HTML page above folders for presentations. .center[  ] --- # Deploying Many Presenatations 1. Make an index.Rmd HTML page 2. Automate Building Lectures ```r # Remove all data and functions in the Environment rm(list=ls()) # Set option for HTML embeds options(htmltools.preserve.raw = FALSE) # Go through tall the subfolders and build anything that is 'new' for( folder in list.dirs("presentations",full.names = TRUE,recursive = FALSE) ) { print( paste("Building",folder) ) blogdown::build_dir( folder, force=FALSE ) } # Make the one page to rule them all... rmarkdown::render("presentations/index.Rmd") # Mac/Linux Specific Automation for moving stuff automatically # Winblows users need to figure out how to do this in another way (or manual) system("rsync -raz --progress lectures/ docs/") system("find docs -iname '*.Rmd' -delete" ) system("find docs -iname '*.zip' -delete" ) ``` --- class: sectionTitle, inverse # gganimate ## .fancy[Finally!] --- # Required Libraries for Animations For this quick tutorial, we'll need to install both the `gganimate` package ```r install.packages("gifski") remotes::install_github("thomasp85/gganimate") library( gganimate ) ``` -- as well as a package that has temporal data for Gross Domestic Product and Life Expecency for 142 different countries from 1952-2007. ```r install.packages("gapminder") library( gapminder ) ``` --- # The Data ```r summary( gapminder ) ``` ``` ## country continent year lifeExp ## Afghanistan: 12 Africa :624 Min. :1952 Min. :23.60 ## Albania : 12 Americas:300 1st Qu.:1966 1st Qu.:48.20 ## Algeria : 12 Asia :396 Median :1980 Median :60.71 ## Angola : 12 Europe :360 Mean :1980 Mean :59.47 ## Argentina : 12 Oceania : 24 3rd Qu.:1993 3rd Qu.:70.85 ## Australia : 12 Max. :2007 Max. :82.60 ## (Other) :1632 ## pop gdpPercap ## Min. :6.001e+04 Min. : 241.2 ## 1st Qu.:2.794e+06 1st Qu.: 1202.1 ## Median :7.024e+06 Median : 3531.8 ## Mean :2.960e+07 Mean : 7215.3 ## 3rd Qu.:1.959e+07 3rd Qu.: 9325.5 ## Max. :1.319e+09 Max. :113523.1 ## ``` --- # Static View of the Data .pull-left[ ```r ggplot( gapminder, aes(gdpPercap, lifeExp, color=country, size=pop)) + geom_point(show.legend=FALSE, alpha=0.7) + scale_color_viridis_d() + scale_x_log10() -> p p ``` Note: - I'm not showing the legend as there would be no place for the plot after `listing 142 country` names. - I'm using a log tranform on the x-axis to `linearize` it a bit. - Data is plot for `all years`. ] .pull-right[ 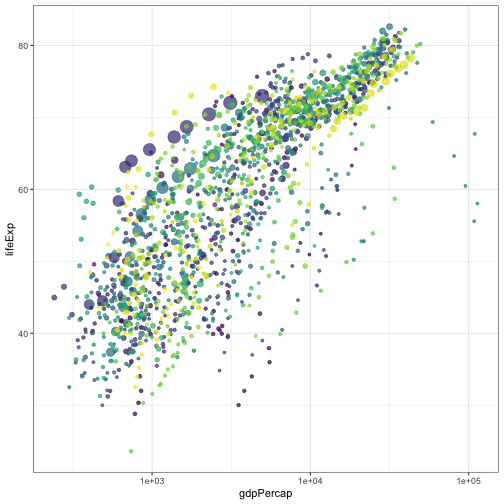<!-- --> ] --- # Animating the Plot Through Time .pull-left[ Add a `transition_time` modifification layer using `year` as the variable. ```r p + transition_time(year) + labs( title = "Year: {frame_time}") ``` ] .pull-right[ <!-- --> ] --- # Integrating Facets .pull-left[ ```r p + transition_time(year) + labs( title = "Year: {frame_time}") + facet_wrap( ~continent ) ``` ] .pull-right[ <!-- --> ] --- .pull-left[  # I see Trailers Man! ] .pull-right[ ```r p + transition_time(year) + labs(title = "Year: {frame_time}") + shadow_wake(wake_length = 0.2, alpha = FALSE) ``` <!-- --> ] --- class: middle background-image: url("https://live.staticflickr.com/65535/50913544171_9a2f1a6252_z_d.jpg" width="400px") background-position: right background-size: auto .center[ # Questions?  ] <p> </p> .bottom[ If you have any questions for about the content presented herein, please feel free to [submit them to me](https://docs.google.com/forms/d/e/1FAIpQLScrAGM5Zl8vZTPqV8DVSnSrf_5enypyp0717jG4PZiTlVHDjQ/viewform?usp=sf_link) and I'll get back to you as soon as possible.]