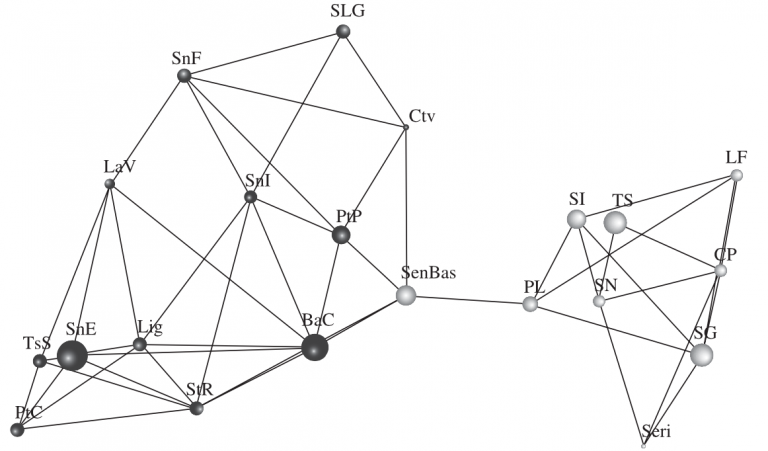
A population graph is a graph-theoretic representation of population genetic covariance, which can arrise from a host of micro and macro evolutionary processes (see Dyer & Nason 2004 for a more complete description) using the Lophocereus schottii topology depicted below.
For these analyses, I have written an R package named
popgraph that does all the under-the-scenes kinds of stuff.
One of the things I’m currently working on is extending this to use in
genomic contexts. For this, I’ve been developing the tools for
additional analyses, one of which is concerned with comparing large
numbers of topologies. Well, today I found an annoying ‘feature’ in the
library that would not give an answer with specific kinds of topological
structure. I didn’t give the wrong answer, it just gave you a “I cannot
give you an answer” kind of answer, which is annoying.
So I fixed it and updated the package (github). If you are following along at home and need to do congruent tests, version 1.5.3 and later will be less annoying (and more information rich). Enjoy!