Introduction
In this class, we will work on all of these components using the open-source R language to explore the data analysis workflow.
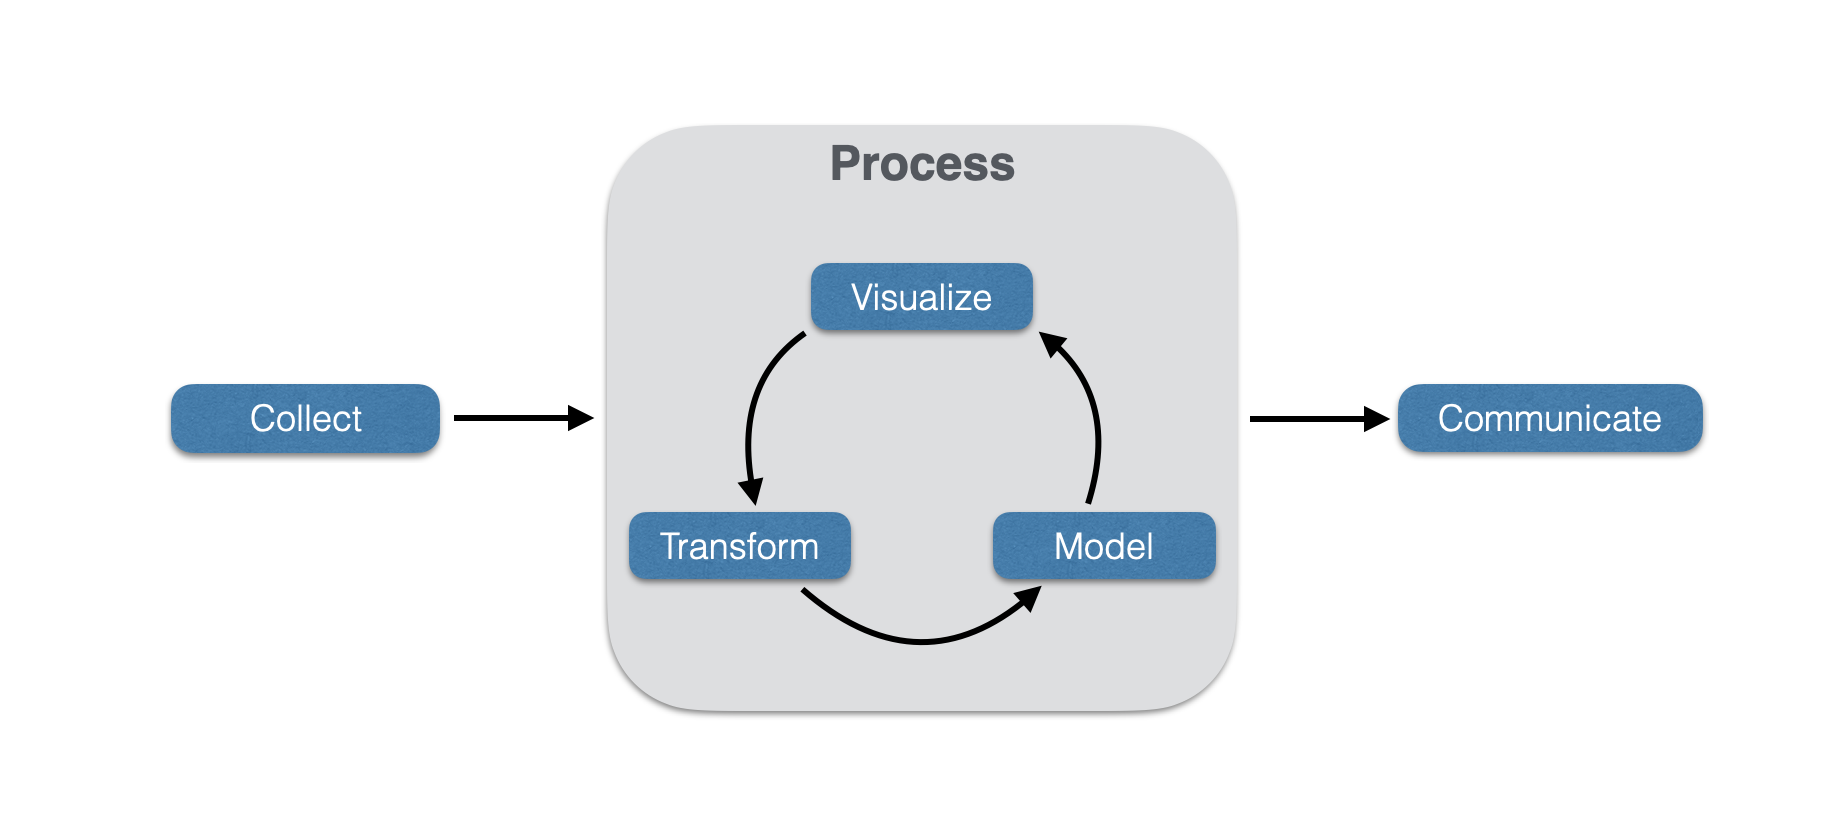
Analysis is not a linear process, it reticulates, and has the following components.
- Collect: Collecting data from an external source into a usable format is often the most time-consuming step in the analysis. The content of this class will provide training in data import from local, online, and database sources.
- Visualize: Visualizing data is key to understanding. In the image above, notice that the variables X and Y in all the displayed data sets have equivalent means, standard deviations, and correlation up to 2 decimal places! We will emphasize visualization, both static and dynamic, throughout this class.
- Transform: Pulling data into your analysis ecosystem is not sufficient. Often, the data needs to be reformatted and reconfigured before it is usable—wait until we get to date, time, and space calculations…
- Model: Applying a model to a dataset is often the quickest process, though often not the end result. Models are subsequently validated and visualized, and often, the output must be transformed and submitted as input to subsequent models.
- Communicate: The effort we put into research and analysis is meaningless without effective communication of your data and findings to a broad audience.
Course Learning Outcomes (CLOs)
Learning objectives may be applied at several heirarchical levels within this course. Overall, the course has specific objectives that are a de facto statement of what you should expect to get from the content of this class. If you look to your individual degree Program Learning Outcomes, you should see how these course-level objectives map directly onto those outcomes.
Let’s start with a definition. In this text, all definitions will be styled as follows:
Learning Objectives are explicit statements that define the knowledge, skills, and abilities you will demonstrate upon successful completion of this course. All assessments are designed to directly measure your achievement of these objectives, ensuring alignment between what you practice, what you’re evaluated on, and what you ultimately master.
This course has the following Course Learning Objectives (CLOs):
CLO-1: Use R to perform reproducible data analysis workflows across environmental contexts
Students will demonstrate functional fluency in using R and its associated libraries (e.g., Tidyverse, Quarto) for data import, transformation, visualization, and analysis, establishing a generalizable skillset for quantitative inquiry.
- Bloom’s Level: Apply / Analyze
- Reinforces: Seeing R as a tool for thinking and doing, not just syntax or statistical analysis
- Notes: This aligns with the practical literacy needed to “think with data” in a coding environment. It emphasizes generalized fluency over memorization or syntax drills.
CLO-2: Analyze and interpret commonly encountered environmental data and associated analyses using appropriate exploratory and statistical techniques
Students will apply foundational exploratory and statistical approaches (e.g., binomial models, contingency tables, regression, spatial summaries) to common ecological, environmental, and evolutionary datasets to support data-driven inference.
- Bloom’s Level: Analyze / Evaluate
- Reinforces: Judgment in data workflows, including exploratory iteration and critique.
- Notes: This keeps the emphasis on doing the analysis and interpreting results, not on statistical derivation of model components. It fits the framing: “not a stats class” but “using common tools to make sense of real data.” It also creates space for iteration and model refinement, aligning with the “model, visualize, refine” paradigm shown above.
CLO-3 Communicate data-driven findings using publication-quality scientific writing and visualizations.
Students will produce clear, compelling, and reproducible documents that communicate quantitative findings, formatted according to scientific norms and using tools like Quarto and Markdown.
- Bloom’s Level: Create
- Reinforces: Scientific communication and agile presentation of quantitative and qualitative information in industry-standard formats.
- Notes: This grounds communication in scientific practice, where students must compose and format their insights clearly and rigorously. It ties tightly into how you assess work (“as if submitting for publication”) and emphasizes narrative data fluency, not just procedural results.
Course Modules
This course is partitioned into the following four self-contained, though sequential, learning modules.
Module 1: The R Ecosystem
Establishing the technical foundation for quantitative analysis in population genetics. Students will master R programming fundamentals, data visualization using the grammar of graphics, and reproducible scientific documentation. These skills are prerequisite for all subsequent evolutionary analyses.
Module 2: Spatial Data
…
Module 3: Statistical Analyses
Course-Level Bloom Spread Progression
| Module | Content Focus | Bloom Spread | Weight | Pattern Type |
|---|---|---|---|---|
| 1 | R Ecosystem (Tools) | 3.8-4.0 | X% | Sequential Mastery (within) |
| 2 | Spatial Data | X-Y | X% | Sequential Mastery (within) |
| 3 | Statisticsal Analyses | X-Y | X% | Sequential Mastery (within) |
| All | All Processes | 3.8 → 5.6 | 100% | Convergent Integration |