Data Literacy
Literacy is broadly defined as the ability to take in, manipulate, and disberse information. In our world, we are continually bombarded with inforamtion. This information comes at us as streams of data (n.b. this is plural, the singular is datum)—much like a firehose and we are trying to hold onto it and perhaps even manipulate it to do something useful for us.
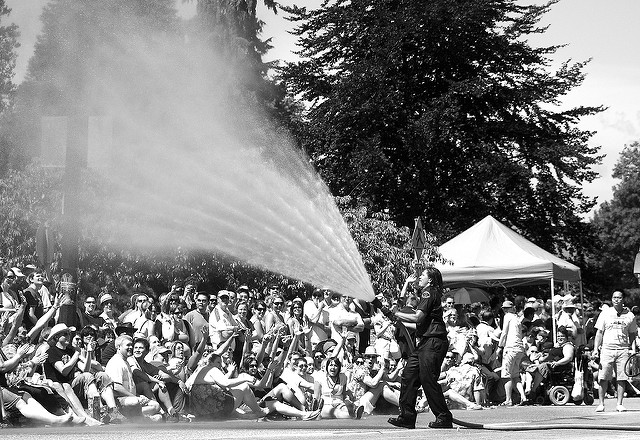
Trying to get inferences from the streams of data around us is like trying to control a firehose (unmodified photo from donnaidh_sidhe cc by-nc-nd).
The whole notion of data streams forms the foundation of this course. As students in the environmental sciences, you must become fascile in the discovery, manipulation, use, and interpretation of data. The amount of data you will be working with is staggering. We no longer just take simple measurements and writing them in our log book and analyze them with pen and pencil later in the semester. Now, we have automated data collection, next generation sequencing, remote sensing, drones (!), and a host of other sources of data.
Here is an example. At the Rice Rivers Center (the VCU Research Station on the James River just outside Richmond Virginia), we have a numerous automated data collection devices. Here is one example. At the Rice Rivers Center, we have many automated data collection sources, one of which is located on the pier. In the table below, we have real data from a slice of one sunday afternoon.
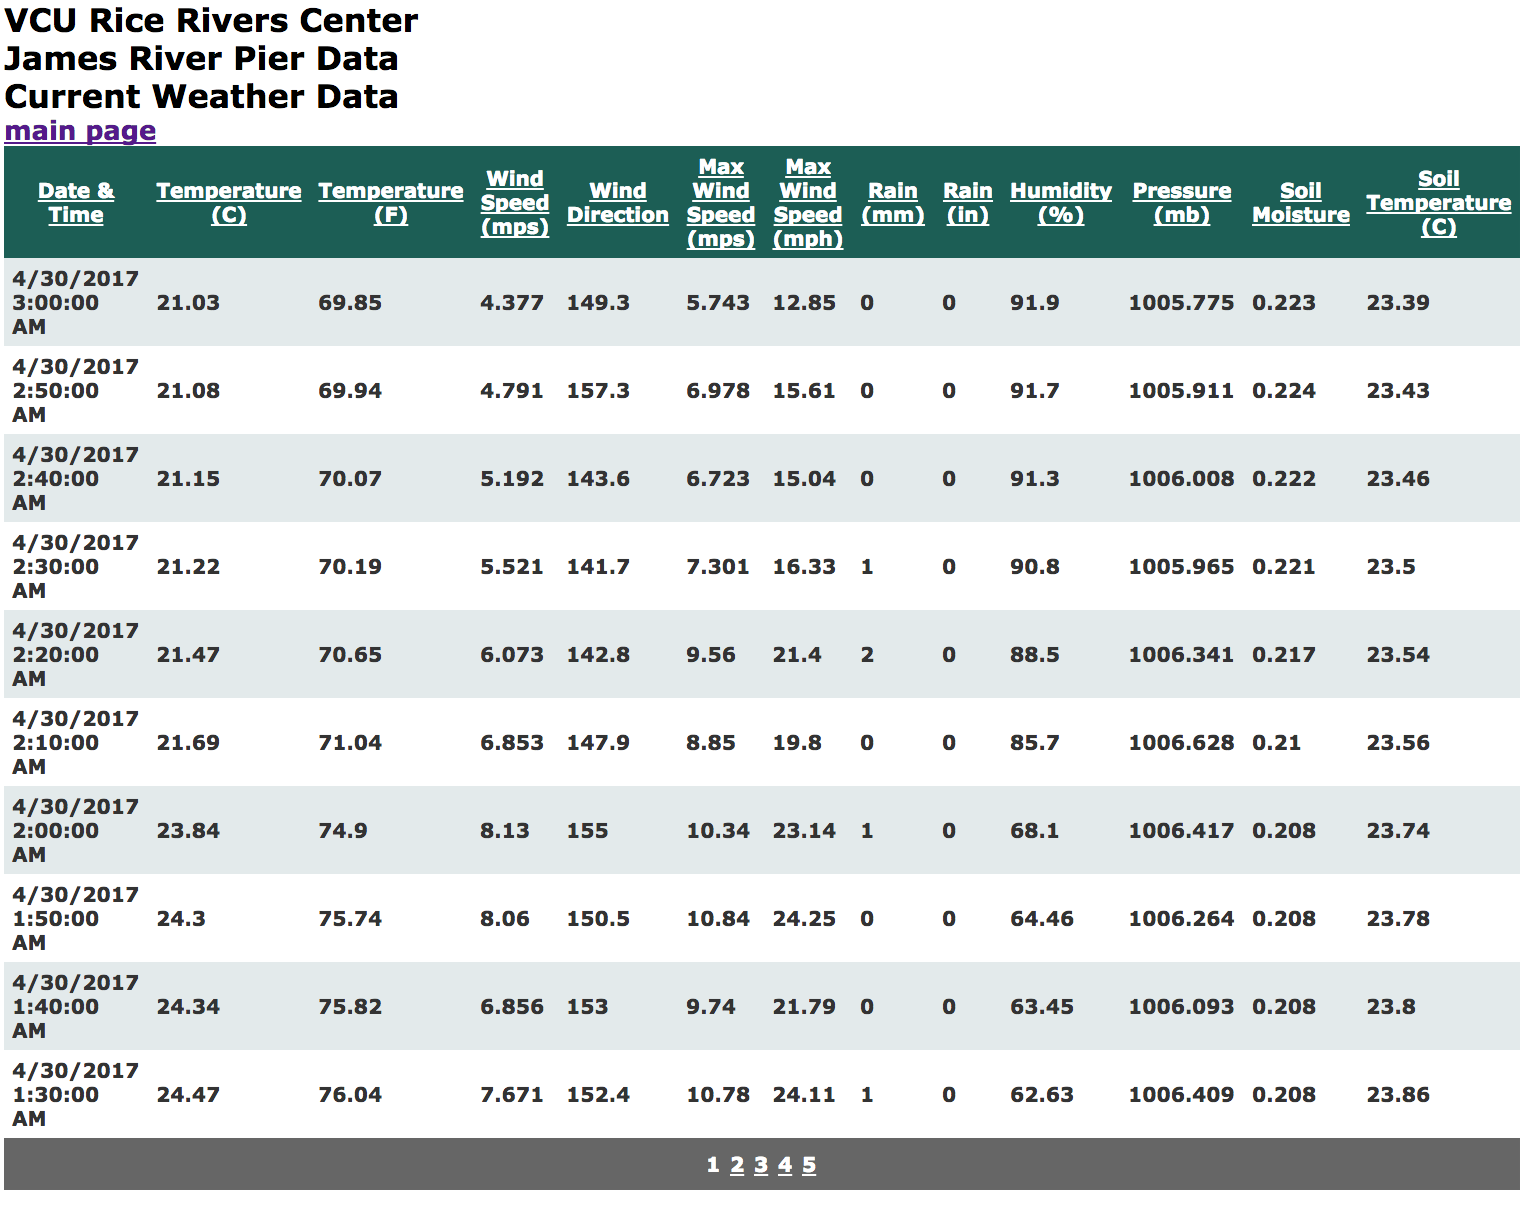
A slice of the data from one instrument tied to the Pier at the Rice Rivers Center. Data from 13 different variables are collected at 10-minute intervals.
During each day, we collect:
num_variables <- 13
collections_per_day <- 24 * 60 / 10
num_data_points <- num_variables * collections_per_day
num_data_points
## [1] 1872That is not too bad, N = 1872 data points per day. So during the course of this semester, which spans
semester_start <- as.Date( "2017-08-24")
semester_end <- as.Date( "2017-12-09")
days <- semester_end - semester_start
days
## Time difference of 107 daysthis unit will have collected a total number of observations equal to:
num_data_points * as.numeric( days )## [1] 200304Just over 200,000 observations! Day in and day out. Over the course of the year there will be 683,280 individual data points collected, stored somewhere, and hopefully provide some bit of insight for humanity (else why are we collecting useless data?). And this is only one such instrument, there are many at this site. And if you were studying how things changed along the river, you would have to have many such sites. It rapidly gets out of control.
So how do we do it? If your first intuition was to open up Excel, this is probably not the class for you. Software that comes as part of an “Office” suite of applications belong in an office environment. We are not office workers. You are data wranglers and this course will teach you how to work with and gain inferences from different kinds of data.
A typical work cycle with data consists of the steps in the following diagram.
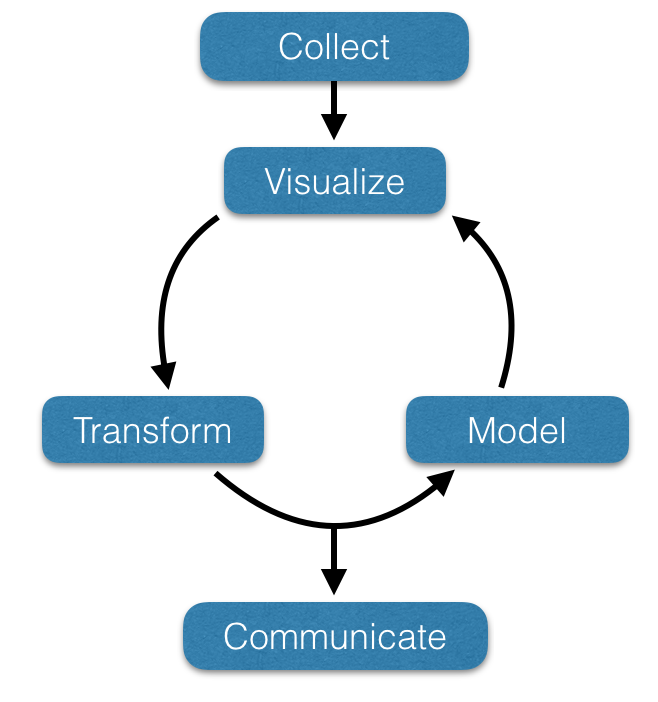
Sequence of events
Clearly, the process of gaining infromation from data requires an iterative approach. Each of the steps that are followed can be defined as follows:
- Collect the Data: Through some mechanisms, you find the raw data by collecting it yourself, going through existing datasets (public or otherwise), or create the data de novo (we call it modeling not ‘making stuff up’).
- Visualize the Data: Some subset of the whole data is examined in a way to provide some valuable insights. Visualization is tremendously important when it comes to making biologically meaningful inferences.
- Tranform the Data: More often than not, the data you have is in some format that was designed for someone elses use and it needs to be manipulated in such a way so that you can get it into some sort of examination and analysis framework.
- Model the Data: Here we are beginning to come up with some questions or assumptions about the data. There is some underlying model we develop. If the goal is statistical inferences, we may be testing to determine if subgroups in the data are different in composition or that certain treatments or conditions have an impact on the values we measured.
- Communicate: Here is where we take the skills you’ve learned within a course like this and from the other courses you’ve taken to communicate the findings of your efforts to the larger world. This is an important step in gaining data literacy.