6 Reproducable Research

As a scientist, the integrity of your data is your #1 priority. In fact, I argue that your ability to write advertisements of your research, which is what manuscripts really are, is secondary to the data that you collect and provide the community. As a practitioner, you get more credit and are providing more to your research community if your data are not only collected with integrity but able to be used by others. In the near future, the DOI for your data sets will be as important as the ones for your manuscripts.
For your data to have the most impact, it needs to be both available and valid. One way to help keep your data intact is to put it in one place and only pull from there to do analyses when you need to do them. You should ALWAYS keep your data and your analyses as close to each other as possible. Once they get separated, things go crazy. For example, consider the case where you send your colleague a copy of your data in a spreadsheet. Now you have two potentially different (and divergent) representations of your data. Any change that either you or your colleague make to the data is not mirrored. Which one is correct? What happens when you put a copy on the laboratory computer and do some analyses with it, then copy it to your ‘backup drive’ (or even worse a thumb drive) and then put a copy of it on your laptop. Then when you get home, a copy goes on your home computer. How many different copies of your data are there in the world? Which one is correct? Somewhere down the road, you will need to recreate a figure for a manuscript, give someone a copy of your data, reanalyze your raw data with a new approach that you run across, etc. Which copy of the data that you haven’t worked on for the last 6+ months is the right one? Which one is valid? Even if you use an awesome naming scheme like “Data.last.version.xls”, “Data.really.last.version.xls”, “I.totally.mean.last.version.xls” etc.. Not going to serve you well in the long run. All of this is terrifying from the perspective of reproducibility.
One way to keep data available with integrity is to have it located in one, and only one, location. If you use Google Drive, this is a pretty easy thing to do. You can keep your spreadsheet online, and then just access the data for your analysis when you need to.
6.1 Keeping Data on Google Drive
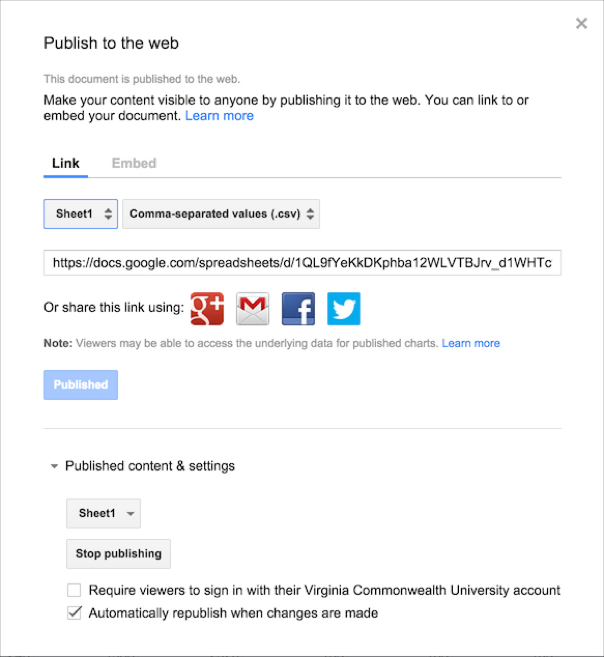
Here is how you set that up. Upload your data into a Google Spreadsheet and then select File \(\to\) Publish to the Web…
You will be given a dialog (as shown here) that allows you to determine how much of the spreadsheet to share. You can publish a particular sheet or the entire document. For our purposes, it is probably best to keep our data on a single sheet within the file and publish them independently. You can also determine the format you want the data presented in, at present the following are available:
- Web page - An html equivalent of the page
- Comma-separated values (*.csv) - This is the preferred format for our purposes.
- Tab-separated values (*.tsv) - Columns separated by tabs. This is also an option for our needs.
- PDF Document (*.pdf) - Portable Document Formats for general dissemination.
- Microsoft Excel (*.xlsx) - Excel formats are great for excel but not openly available.
- OpenDocument Spreadsheet (*.ods) - Spreadsheet file format from OpenOffice.
It is in my opinion preferable to keep your data in a format that is accessible to the broadest audience. It is not a secret that programs change file formats and old proprietary binary formats can become corrupted and unreadable. It would be a shame to keep the data that you work so hard on in a format that you can no longer access or that your potential future colleagues and collaborators cannot get access to…
For this example, the data from the first sheet are provided as a *.csv file and can be accessed by that long URL.
In R, we can access this spreadsheet directly through that URL, which allows us to have our data located in a single centralized location and accessible by a broad range of applications and uses, none of which have the ability to duplicate your data (thereby causing a fork) or make any changes to its internal structure. Here is how it is done. Load in the RCurl library that allows us to grab the contents at a site programatically.
library(RCurl)
link <- "https://docs.google.com/spreadsheets/d/1QL9fYeKkDKphba12WLVTBJrv_d1WHTc9SrZoBeIFgj8/pub?gid=0&single=true&output=csv"
url <- getURL( link )
Initiate a text connection between R and the remote server at Google.
con <- textConnection( url )Load in the gstudio library and read the data in as a normal data file. This last part is identical to what we would do for a normal file on our computer, it is the first two steps that extend this approach to use remote files via a url.
library(gstudio)
cornus <- read_population( con, type="column", locus.columns = 5:14, sep=",")
summary(cornus)
## Population SampleID X.Coordinate Y.Coordinate
## Min. :2.000 Min. :203.0 Min. : 346 Min. : 254
## 1st Qu.:3.000 1st Qu.:315.5 1st Qu.:1482 1st Qu.:2231
## Median :4.000 Median :428.0 Median :1656 Median :2928
## Mean :3.809 Mean :428.0 Mean :1747 Mean :2588
## 3rd Qu.:5.000 3rd Qu.:540.5 3rd Qu.:1914 3rd Qu.:3082
## Max. :6.000 Max. :653.0 Max. :3778 Max. :6148
##
## Cf.G8 Cf.H18 Cf.N5 Cf.N10
## 155:165 : 18 105:119 : 23 170:170 :251 189:193 : 25
## 165:165 : 15 105:105 : 18 162:170 : 34 189:201 : 20
## 167:167 : 13 107:119 : 16 172:172 : 34 189:197 : 18
## 155:159 : 12 121:121 : 16 164:170 : 27 189:189 : 17
## 157:157 : 12 105:113 : 15 166:170 : 19 193:193 : 17
## (Other) :372 (Other) :362 (Other) : 50 (Other) :341
## NA's : 9 NA's : 1 NA's : 36 NA's : 13
## Cf.O5
## 182:196 : 43
## 182:182 : 41
## 178:196 : 28
## 178:182 : 25
## 180:180 : 24
## (Other) :282
## NA's : 8The key here is that the contents of the data file are available but you cannot manipulate it. If you do need to make changes to the raw data, you can do this through the Google Drive interface. Once you do that, all you would have to do is rerun your scripts and every one of them will point to the only and latest version of the data set.
I recommend looking into more approaches on Reproducible Research as they will help you, professionally, get the most out of your efforts.
6.2 Integrating into Slack
If you and your group use Slack to help in productivity, you can post text and results directly from R into your Slack channels without the copy-paste, save file, upload, etc. routine. Here is how you set it up. This is still a bit in development and the latest version needs a little tweeking to work correctly (see subsection below).
While this package is currently on CRAN, I recommend downloading the latest version from github. First things first, I recommend installing the latest version from the github repository.
library(devtools)
install_github("hrbrmstr/slackr")
6.2.1 Fixing Problem with Version 1.4.1
There is a slight problem though. The current version of the slackr library has an error in it associated with (perhaps) a recent change in the Slack API that has not been fixed by the developer.
For me to get this to work, I had to compile the package myself after making the following change in one file. To fix it, do the following:
- Download (or checkout) the repository from github at: https://github.com/hrbrmstr/slackr
- Open the project in RStudio
- Open the R file names
slackr_utils.R
- In the function named
slackr_imsthe last line (line 117) is something likedplyr::left_join( %some stuff% ). Replace this line withsuppressWarnings( merge(users, ims, by.x="id", by.y='user') ) - The compile and install the package as:
library(devtools)
load_all()
build()
install()
It should work just fine from then on. Hopefully, on the next time that this package is updated by the author, the left_join() problem will have been resolved. This issue had been marked as “resolved” in the github issues a while back but apparently not pushed to the repository.
6.2.2 Configuration
You can configure it from the command line, but perhaps the easiest way to get it going is to set up a config file. By default, it will look for the file ~/.slackr This is a plain text file (actually it is a Debian Control File - DCF) and needs the following content
api_token: xoxp-XXXXXXXXXXX-XXXXXXXXX-XXXXXXXXXX-XXXXXXXXX
channel: #r
username: rodney
incoming_webhook_url: https://hooks.slack.com/services/XXXXXXXX/XXXXXXXX/XXXXXXXX
You need to get the api_token and the incoming_webhook_url from slack itself. Save that file.
6.2.3 Sending Text and Graphical Ouput
Both textual output (e.g., the results of an analysis) or graphical output (such as ggplot objects) can be sent to your slack channels now. Here are some examples:
Which results in the following in my #r slack channel:
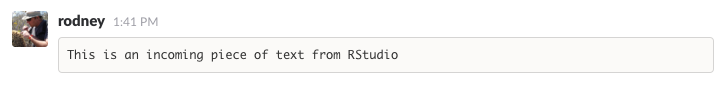
There is also a provision for sending output graphics like ggplot objects. Here is an example of a barplot of heterozygosity across all loci in the included arapat dataset.
library(gstudio)
library(ggplot2)
data(arapat)
he <- genetic_diversity(arapat,mode="He")
p <- ggplot( he, aes(x=Locus, y=He)) + geom_bar(stat="identity") + theme_bw()
ggslack(p)
Which produces the following image in my channel
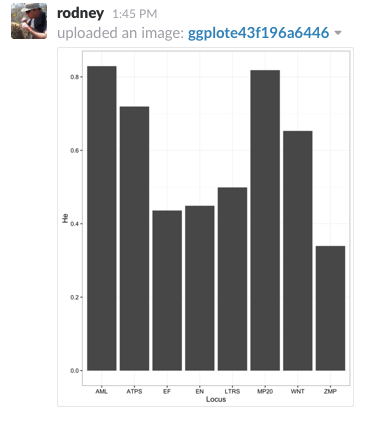
Very Cool! I can imagine a lot of situations where it would be helpful to have a script send a slack notification when it has finished (or crapped out on an error) in some long-running analyses. Now if we could just get slack to integrate with RStudio server version…
6.2.4 Markdown
This entire book is written in RMarkdown, a text-based approach for mixing verbiage and analyses into a single document. There are several advantages to adopting an open appraoch such as this including:
1. All the data and analyses are in the same place. The only reason you see a graph above is because the markdown document has the specific code in it to make that graphical output. It is not done in some other program and either imported or cut-and-paste into this document.
2. It is in a text format. If you wish, you can see the entirety of this text on my github site.
This means I can take advantage of: - Version control. I can make branches, develop new parts, and merge them back in. - No need for those ad hoc naming schemes (last_version.docx, really_last_version.docx, Im_totally_lost_which_version_is_this.docx), it is all kept in sync. - Collaborations with others is easy, just like real programmers. 3. Analyses and figures can be re-run and changes in the output can be inserted into your documents automatically. 4. Markdown documents are the source and can be converted into HTML, PDF, DOCX, presentations, etc. All from the same source materials. This means that you work on one file and when you need to convert it into a finalized format, you can do so with ease.
To get started working with markdown, go read over the RMarkdown website and fire up RStudio. It has all the components built-in for you.